Clearer picture of watershed quality helps people put dollar values on improvements
It may be easy to argue that cleaning up a river is inherently good, but it’s far harder to put a monetary value on the outcome of a clean-up — especially when each person appreciates the condition and uses and expectations for a local or distant body of water in their own way.
Measuring that value is important, though, as government agencies run cost-benefit calculations and consider how to best deploy limited resources. Researchers including economists at the University of Wisconsin–Madison and funded by the U.S. Environmental Protection Agency have developed a method to gauge the value of improvements in watersheds protected by the federal Clean Water Act. Their results, which surveyed thousands of residents of three major river watersheds in the United States, were published recently in the Proceedings of the National Academy of Sciences.

Daniel Phaneuf
“From the perspective of economics, human well-being can be generated by a lot of different things,” says Daniel Phaneuf, UW–Madison professor of agricultural and applied economics and an author of the new study. “At a fundamental level, we’re interested in measuring how much households are willing to trade off spending on other things in order to have better environmental quality.”
Quite a bit more if the improvements are nearby, it turns out. But the question of just how much began with another challenge: Just what do we mean by improvement?
Ecologists from the University of Minnesota catalogued biological data from 19,000 sites across the watersheds of three major river basins — the Upper Mississippi, Ohio and Tennessee rivers — in parts of 18 states, creating detailed maps describing smaller subunits of the watersheds according to the EPA-created Biological Condition Gradient. BCG is a scale describing six levels of human disturbance of a watershed, from a natural state through noticeable changes and shifts in the animal and plant species that live in or around the water and on to extreme degradation.
“We wanted this to be meaningful and understandable to everyone, so we didn’t use technical terms like ‘biological condition gradient,’” Phaneuf says. “We worked with ecologists and graphic artists to create ways to represent these differences in biodiversity and visual conditions and the sort of human activities — like boating, swimming or finishing — each level of the BCG may actually represent.”
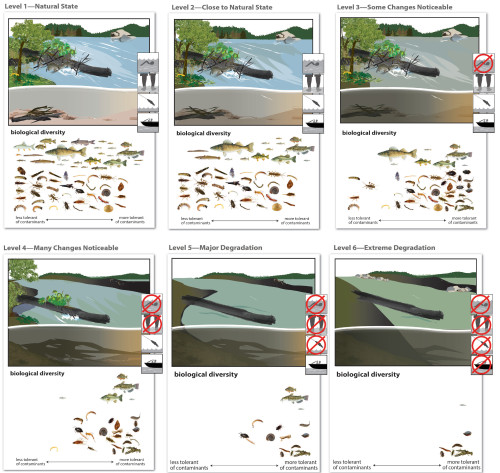
Researchers used visual and textual descriptions of the stepwise differences in levels of ecological integrity when asking survey participants about their valuations of watershed quality. University of Wisconsin–Madison
Along with watershed maps, the researchers took visual and textual descriptions of the stepwise differences in levels of ecological integrity to a survey group of 2,000 households across the river basins, presenting each one with maps describing current conditions in watersheds both in their area and farther away and maps describing improvements from potential remediation projects in those areas. They asked an overarching question for each cleanup scenario: How much more would you be willing to pay in taxes every year — ranging from $20 to $750 — to make this improvement happen?
Respondents were willing to pay about $300 annually for one-level improvements in BCG in a nearby watershed, pushing closer to $500 if the changes would meet a Level 2 designation — a swimmable waterway just one step away from a natural state.
“That’s not so much of a surprise. People put a lot of value on the watersheds they get to see and enjoy,” Phaneuf says. “What may be a surprise, though, is that people are willing to pay even when it’s not in their backyard. That is something that EPA is quite interested in.”
The survey respondents were still willing to take on nearly $100 in taxes and up to more than $250 for faraway watershed ecosystem enhancements, depending on the size of the affected area and extent of the improvements.
Some of the differences were regional, connected to conditions nearby or state boundaries.
“We did see values vary based on different baselines,” Phaneuf said. “If you’re at a place that already has pretty good water quality, it’s not necessarily that valuable to go up a little bit. Whereas if you’re at a place that already that has pretty poor water quality, the value of incrementally improving things can be of higher interest.”
People were also willing to pay more for improvements within their home state, even if they happened in watersheds far from their home.
The methods for describing watersheds to non-scientists are an important step forward in communicating some complex concepts of ecological integrity, Phaneuf says. The results of the new survey and the roadmap for measuring monetary value of environmental improvements should prove useful to regulators and policymakers.
“A lot of earlier research has suggested that administering the Clean Water Act has cost more than the benefits it has generated. Our research is motivated by the idea that perhaps we’re missing some of the benefits,” Phaneuf says. “This type of careful look at how people value clean waters can help in assessing whether and to what extent proposed regulations are creating positive value.”
This research was supported by funding from the U.S. Environmental Protection Agency (agreement No. 8361660).
Tags: economics, environment, research, water
-
Interwoven
How Indigenous knowledge and science can work together to communicate about climate.
-
UW–Madison’s reach throughout Wisconsin adds up to $38.9 billion a year
The university supports more than 287,000 jobs and helps drive private-sector growth.
-
‘Being part of something bigger than you’ with Badger Volunteers
UW–Madison students head into the local community to find purpose and make a difference.
-
UW–Madison’s Tech Exploration Lab: Where the classroom meets the real world
The lab is built around a simple expectation: Students come to build, test and refine projects with real problems in mind.