Mapping cropland: UW-Madison plays critical role in worldwide map
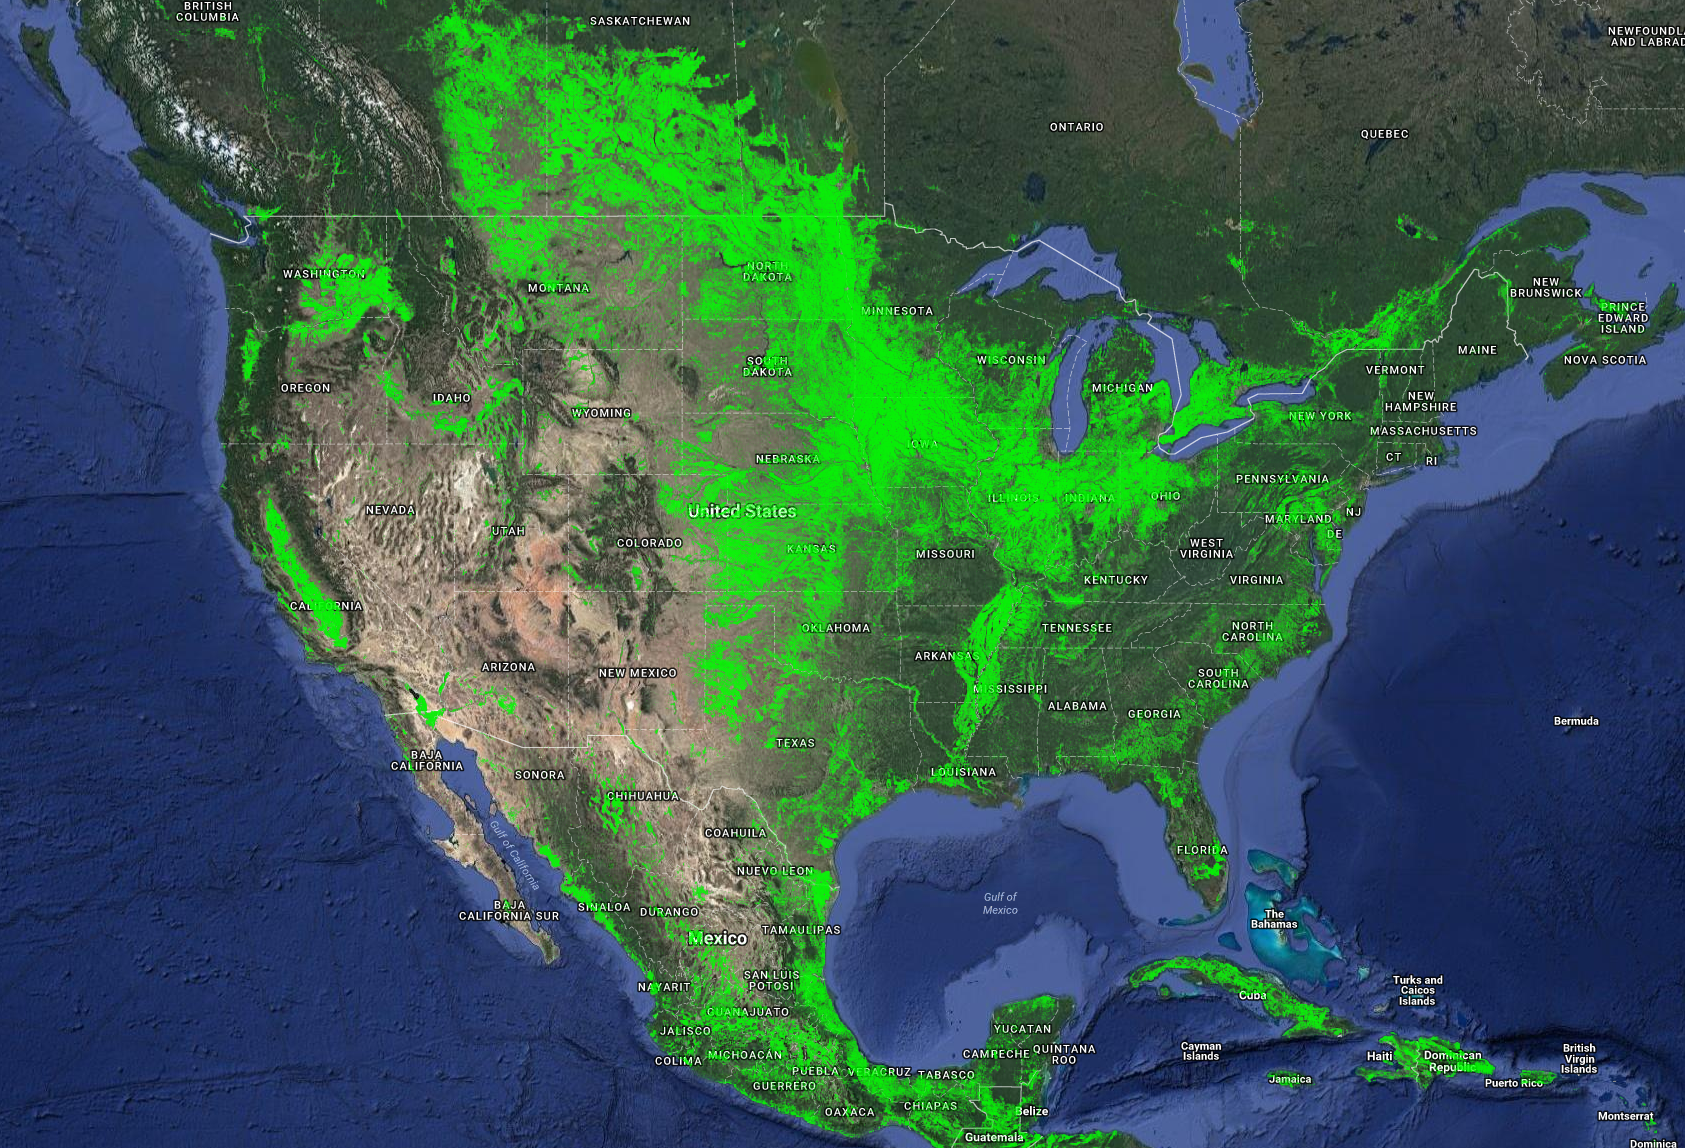
The broad swaths of agricultural activity shown in green here reflect weather, climate, geography, soil type and other factors, and are best seen from a polar-orbiting satellite like Landsat. GFSAD30
A global collaboration has just released a satellite-based map of world croplands that “found” 625 million to 875 million acres that were not known to national agricultural authorities. Farmland, the project found, covers 4.67 billion acres, about 1.9 times the total area of the United States.
The computer-generated map grew from four years of work by the NASA-funded Global Food Security-Support Analysis Data @ 30-m (GFSAD30) project.
Mutlu Ozdogan, an associate professor of environmental studies and wildlife ecology at the University of Wisconsin–Madison who was a co-principal investigator with GFSAD30, says the goal was to use NASA data to make and distribute products with societal purposes.
“We are creating a detailed database of landscape information” on plots that are just 30 meters (about 100 feet) square, Ozdogan says. “Now we can say, for example, ‘This plot grows crops; and it’s always irrigated.’ So we can calculate how much food can be produced on any given tract, region, or nation, and how much irrigation water will be needed. And we can estimate how climate change and other environmental variables will affect that output.”
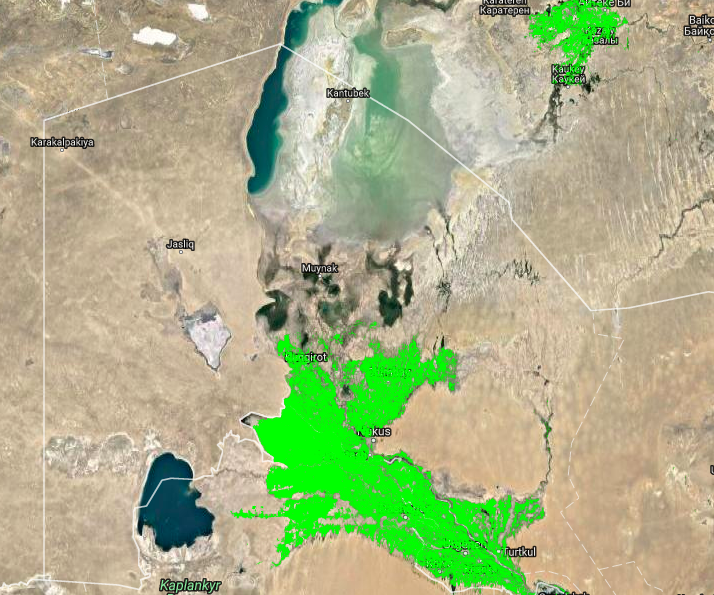
Green shows irrigated cotton farms around the Aral Sea in Central Asia. These farms are irrigated by rivers that fed the Sea, which is running dry and heavily polluted with agricultural chemicals. “This detailed map shows the utility of satellite mapping for assessing current and future needs for irrigation water,” says Mutlu Ozdogan, a co-principal investigator on the GFSAD30 project. This area, once part of the Soviet Union, is on the Kazakhstan-Uzbekistan border. GFSAD30
NASA’s interest is global food security, Ozdogan says. “This product can be used by agencies concerned with food supply as the population grows from 7.6 billion today to a projected 10 billion by year 2050. The existing global data has been unreliable or outdated.”
Overall, the study found that cropland is 15 to 20 percent larger than previous estimates, which is based on national statistics gathered with varying techniques and varying accuracy.
GFSAD30 relied on Landsat 7 and 8 satellite imagery that studied “pixels” 30-meters on a side, which is by far the highest resolution of any global agricultural dataset.
With a few clicks, a user can drill down from a continent-sized map to a particular village, valley or farm field.
“The map clearly shows individual farm fields, big or small, at any location in the world,” said Prasad Thenkabail, a research geographer at the U.S. Geological Survey and principal investigator for the project. “Given the high resolution of 30 meters and 0.09 hectares [0.23 acres] per pixel, a big advantage is the ability to see croplands in any country and sub-national regions, including states, provinces, districts, counties and villages.”
The new map identified cropland growing feed, food, fiber, permanent orchards like fruit or olives, but not grassland, says Ozdogan, who worked with graduate student Aparna Phalke on the project.
The satellites detected several wavelengths of light in each pixel. “Say we are looking at a field,” Ozdogan says. “How does the intensity and nature of the infrared light change at different times of the year? A crop changes very quickly from planting through growing, harvesting, while a forest changes very slowly. We use an algorithm that is tuned to these characteristics, using observations from the satellites.”
The dataset is enormous, and calculations are performed on Google’s “Earth Engine,” Ozdogan says. “Google has invested in satellite processing; they downloaded all Landsat data to their servers and hold it on spinning disks, and their engineers have built tools to analyze these massive datasets using parallel processing.”
“This new wall-to-wall map can help governments apportion resources.”
Mutlu Ozdogan
Ozdogan’s programming uses machine learning to fine-tune that processing. “We have trained the software to look for agriculture, using principles of neural networks and decision trees to recognize agriculture,” he says. Accuracy is key, he adds. “The total project performed about 18,000 ‘ground-truthing’ efforts, where in many cases experts visited particular pixels to check the categorization.”
Later analyses of the Landsat data will concern:
- How many times a field is cultivated per growing season;
- The identity of eight major crops, including corn, soybeans, rice and wheat;
- Whether the plot is irrigated.
One-fifth of world cropland is irrigated, which boosts yield – and may even make farming possible — but also raises several environmental and infrastructure issues. “India is the number one irrigator in the world, but it doesn’t know exactly how much area is irrigated; a lot is informal and not reported in county-level statistics,” Ozdogan says.
Most agricultural policies, such as the deployment of extension workers, “result from decisions that are based on samples, not the whole picture of farmland,” Ozdogan says. “This new wall-to-wall map can help governments apportion resources. It also lends itself to additional ways of analyzing data, including some that have yet to be discovered.”
-
Interwoven
How Indigenous knowledge and science can work together to communicate about climate.
-
UW–Madison’s reach throughout Wisconsin adds up to $38.9 billion a year
The university supports more than 287,000 jobs and helps drive private-sector growth.
-
‘Being part of something bigger than you’ with Badger Volunteers
UW–Madison students head into the local community to find purpose and make a difference.
-
UW–Madison’s Tech Exploration Lab: Where the classroom meets the real world
The lab is built around a simple expectation: Students come to build, test and refine projects with real problems in mind.