Reddit competes to visualize Madison’s prized Lake Mendota ice data
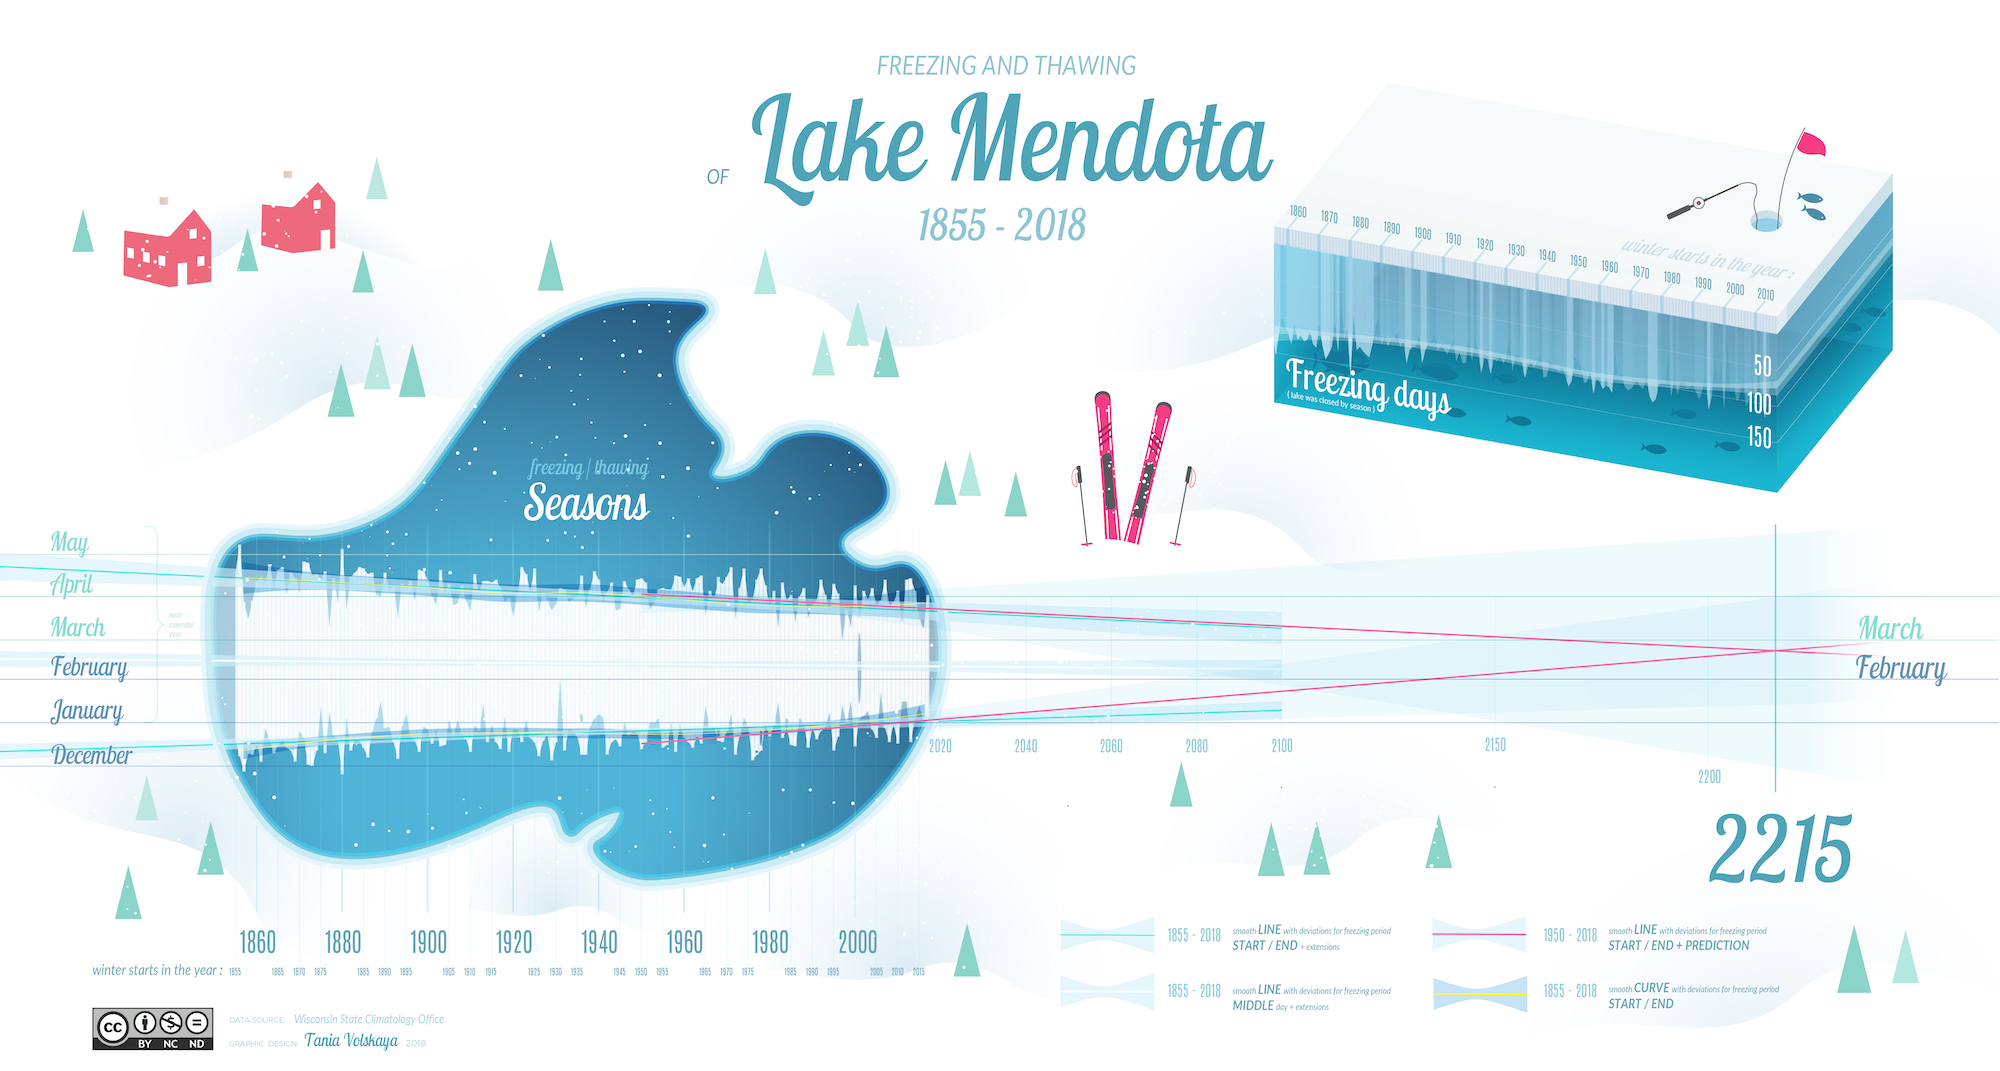
Taking inspiration from the lake, this visualization shows the dates of freezing and thawing through the years overlaid on an outline of Lake Mendota. By extrapolating the warming trend, the visualization calculates the lake may no longer freeze at all by 2215, but researchers caution that such forecasting is difficult. Image by Tania Volskaya
For 166 years, observers from the University of Wisconsin–Madison and the Wisconsin State Climatology Office have recorded a central aspect of life in the city — the dates when Lake Mendota freezes and thaws. Those dates mark the transition from fishing to ice fishing, from canoeing to snow shoeing.
They’re also a record of the region’s climate going back to shortly after statehood. While daily temperature swings are erratic — in the wake of the polar vortex, temps went from -26 degrees to 45 degrees Fahrenheit in a matter of days in Madison — lake ice is a more even record of temperatures from year to year. Visualizing that data can help us see how our climate has changed and where it might be going.
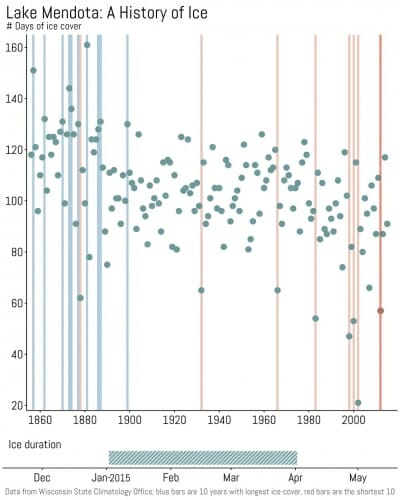
Click on the image to see the animation. In the animation, the duration of ice cover is plotted out year by year. Blue lines mark the 10 years with the longest duration, while orange lines mark the 10 years with the shortest duration. While all of the longest years took place in the 19th century, most of the shortest years occurred in recent decades, showing a trend toward reduced ice cover. Click on the photo to see the animation. Image by Jordan Read
That kind of data visualization is the specialty of the DataIsBeautiful subreddit, a community on the massively popular online forum Reddit dedicated to visually representing information in a compelling way to reveal hidden truths. In December, the community directed its efforts at UW–Madison’s prized Lake Mendota ice data for their monthly competition to find the best visualization.
Nothing was at stake but bragging rights. Still, the community turned out dozens of unique submissions, from static calendars to interactive charts to deep statistical dives, many with a designer’s flair.
“What was interesting about this challenge was it made people think about different ways of showing that data,” says Hilary Dugan, a UW–Madison professor of limnology who submitted her own entry to the competition.
The visualizations reveal a concerning trend that’s been known to scientists at UW–Madison and elsewhere for decades: ice is disappearing on Lake Mendota. Since the middle of the 19th century, the average duration of ice on the lake has shrunk by about a month.
How the data is plotted reveals different aspects of that warming trend.
Like many other competitors, Jordan Read, a data scientist with the U.S. Geological Survey’s Wisconsin Water Sciences Center in Middleton, decided to animate the data. His submission highlights the 10 longest and shortest durations of ice cover as they appear when plotted out year by year. All 10 of the longest years, shown in blue, took place before 1900. The animation ends with a flurry of orange highlighting the seven shortest years that have all occurred in the last four decades.
“Animations allow you to throw in more information and have people still be able to understand it,” says Dugan. “You get more information than you would from a static figure.”
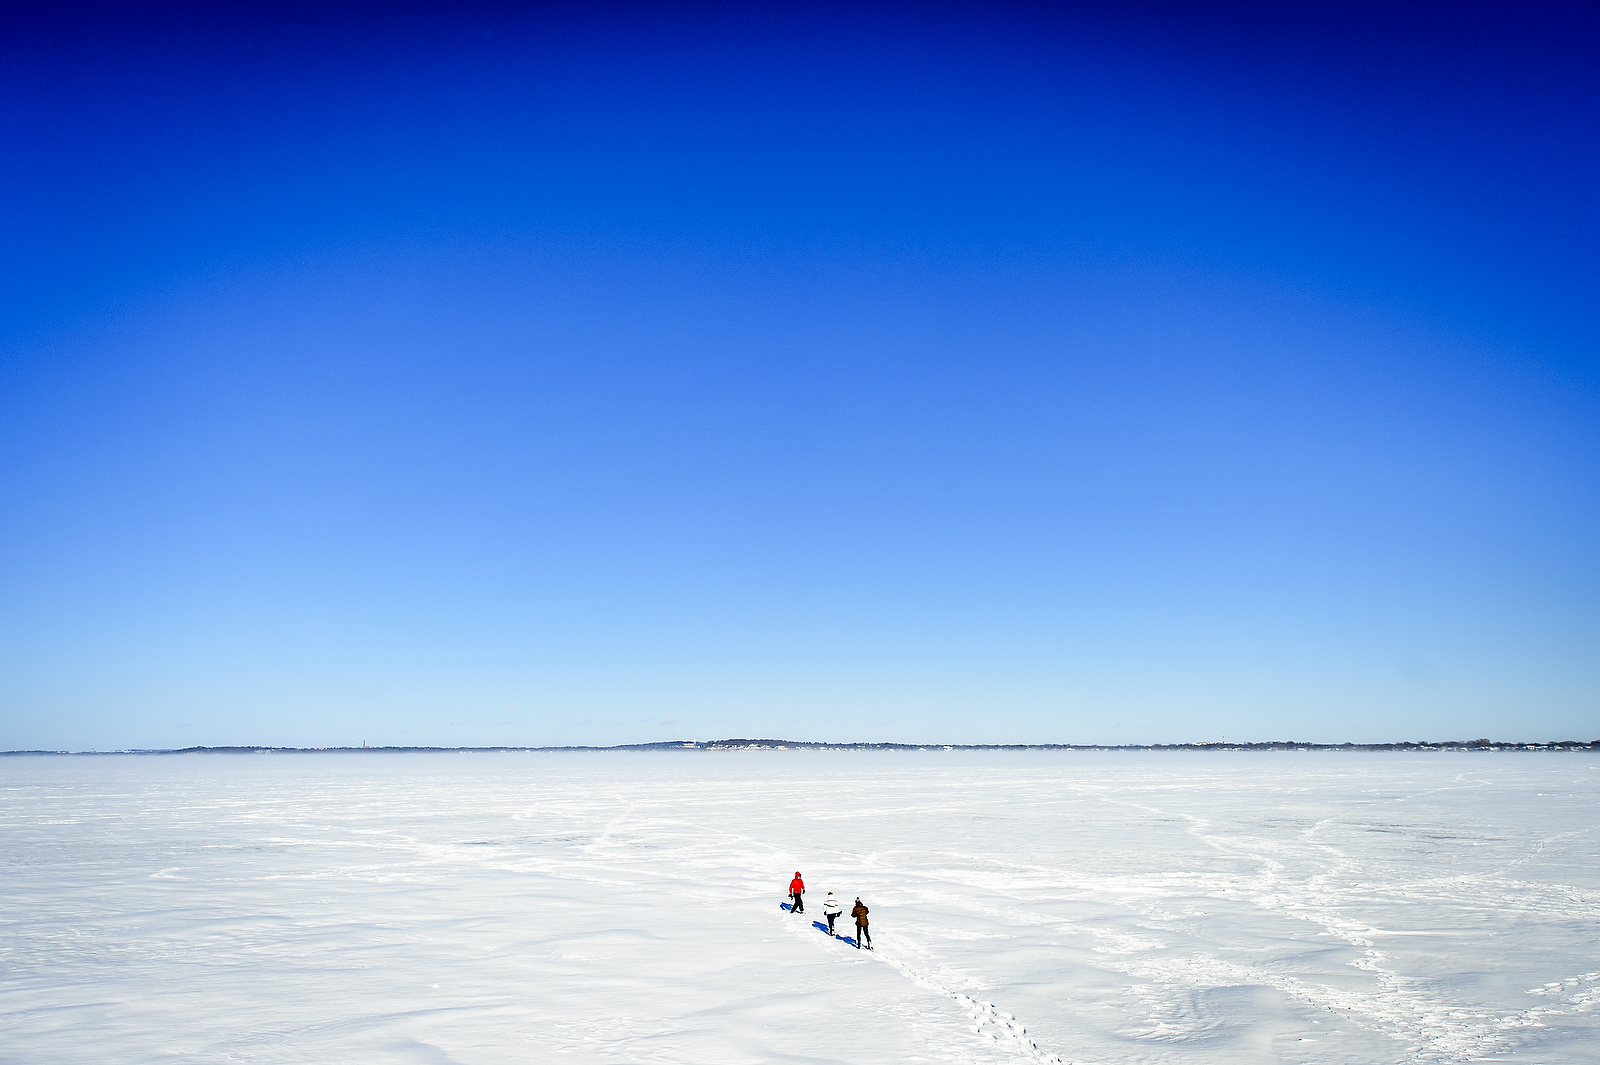
A group of adventurous individuals make their way onto the ice of Lake Mendota as temperatures hover around zero degrees Fahrenheit at the University of Wisconsin–Madison on Jan. 29, 2019. Photo: Bryce Richter
Other submissions took inspiration from the lake by turning the data into a lake bed or series of submerged ice crystals that rise and fall with the duration of ice cover through the decades. Many attempted to forecast when Lake Mendota might stop freezing entirely, something that is difficult to predict, says John Magnuson, director emeritus of the Center for Limnology.
Recent research by Magnuson and others shows that tens of thousands of northern lakes like Lake Mendota are at risk of becoming ice-free as the climate warms. But annual variation in weather and future increases in air temperature mean that extending the recent trend into the future may not accurately pinpoint the lake’s first ice-free year.
The shortest duration observed to date was when the lake was only frozen for 21 days in 2002. It froze for 10 days in January and another 11 days in March. 2002 was one of only seven years the lake has frozen, opened and frozen again in a single season. This year is one of those years, and they may become more common.
The submission that won the Reddit competition was a deep dive into lake ice duration, opening and closing dates, outliers and trends in the data by Lucas Marra de Freitas, a Brazilian economist currently studying in Germany. One of his dozen graphs breaks the data into four time periods, showing a striking shift toward shorter ice durations as the 21st century approaches.
Lake Mendota’s ice data is among the longest such records in the world. But some are much older. Lake ice data from a Shinto shrine in Japan dates to the 1400s and is prized by researchers like Magnuson because it predates the Industrial Revolution, when emissions of greenhouse gases started to greatly increase in the 18th century. Long records are critical for identifying slow-moving trends.
“If you want to look at something slow like climate change, you need at least 100 years of data,” says Magnuson.
Magnuson says limnologists began by studying lakes in the summer, in large part because that’s when professors were free from teaching duties and could conduct research. But there’s growing interest in understanding how lakes fare underneath their winter ice. As data visualizations and other research show lake ice being threatened in many temperate climates by warming temperatures, that opportunity is slipping away.
“If we don’t get our act together, we may not even understand what we’re losing,” says Magnuson.
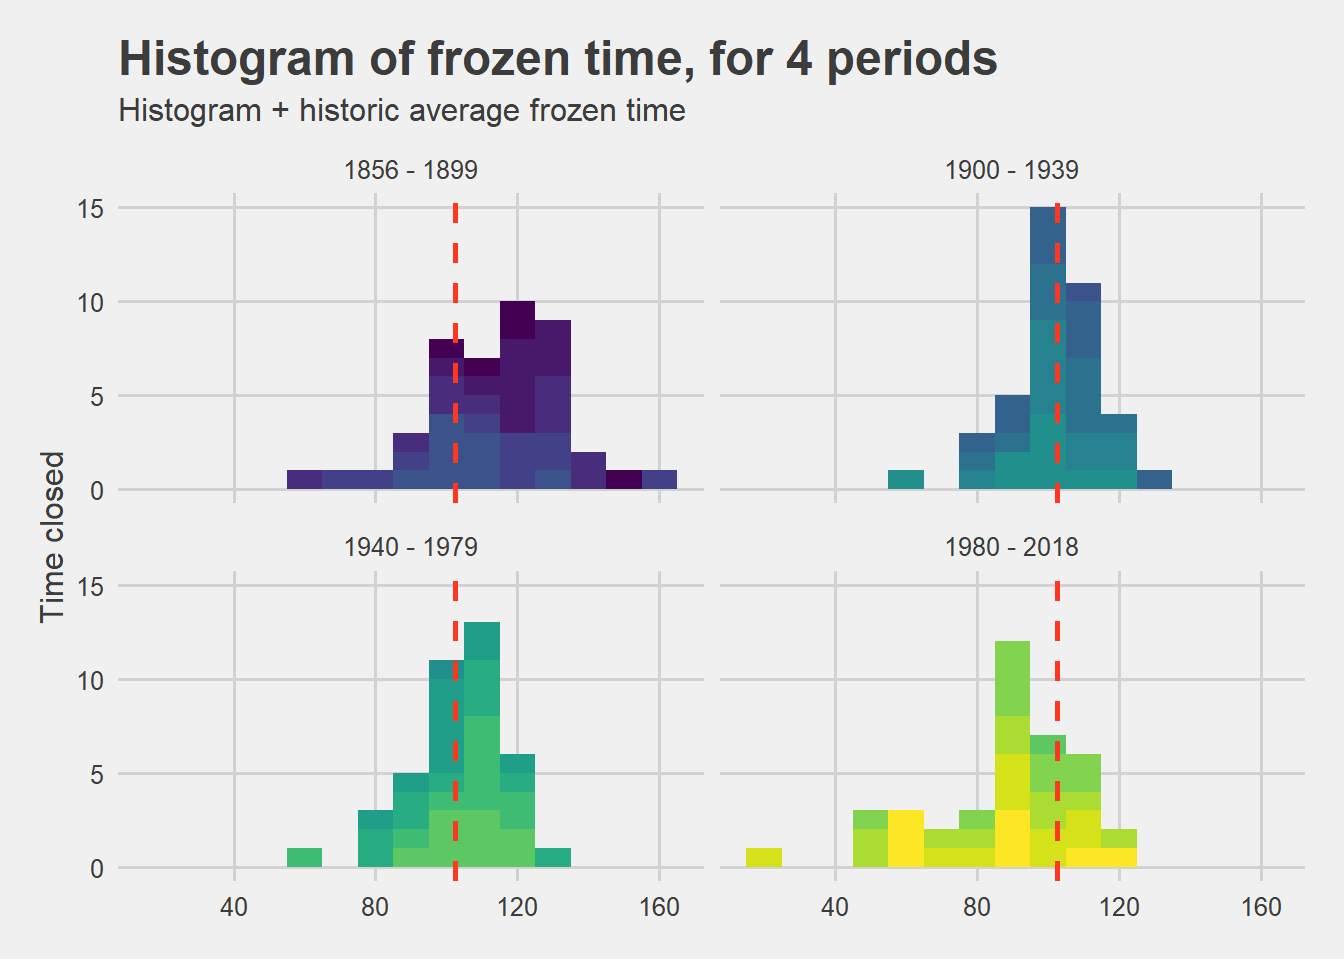
Four histograms show how the duration of ice cover on Lake Mendota has changed over the years. While years with long ice cover were common in the 19th century, they have grown rarer over the years. As shown in the bottom right, most recent years are frozen for a shorter period than average. The overall average is shown by the dotted red line. Image by Lucas Marra
Tags: climate change, data, lake mendota, limnology
-
Interwoven
How Indigenous knowledge and science can work together to communicate about climate.
-
UW–Madison’s reach throughout Wisconsin adds up to $38.9 billion a year
The university supports more than 287,000 jobs and helps drive private-sector growth.
-
‘Being part of something bigger than you’ with Badger Volunteers
UW–Madison students head into the local community to find purpose and make a difference.
-
UW–Madison’s Tech Exploration Lab: Where the classroom meets the real world
The lab is built around a simple expectation: Students come to build, test and refine projects with real problems in mind.