Study finds Wisconsin’s African American poverty rate three to four times higher than white poverty rate
A supplement to the annual Wisconsin Poverty Report released this week examines poverty and income by race and ethnicity in the state overall and in Milwaukee County, Wisconsin’s most populous county.
“Poverty, Incomes, Race and Ethnicity in Wisconsin and Milwaukee” finds large disparities in poverty between white residents and those of color, especially African Americans.
 The supplement, like the Wisconsin Poverty Report, uses the Wisconsin Poverty Measure (WPM), which was designed by researchers at the University of Wisconsin–Madison’s Institute for Research on Poverty (IRP) to inform policy by offering up-to-date and place-specific data that go beyond the official statistics for Wisconsin.
WPM creator Timothy Smeeding, economics and public affairs professor at UW–Madison and report and supplement coauthor with Katherine Thornton, an IRP senior programmer analyst, notes that one of the important differences between the WPM and the official poverty measure that produces the statistics commonly cited by news media is that the WPM considers noncash benefits and taxes, including refundable tax credits. Including these forms of assistance and tax credits that reward work in poverty calculations produces much more accurate estimates of resources and need than is possible using the official measure.
Recent attention to racial segregation in Milwaukee; poor economic, educational, and social outcomes for black children in Wisconsin; and large racial differences in incarceration rates suggest that populations of color are not faring well in the state and especially not in Milwaukee.
 In this supplement, researchers take a closer look. The population is from the 2016 American Community Survey (ACS) sample and is divided into three groups: black non-Hispanics (7.2 percent of the Wisconsin population), Hispanic and other ethnicities and races, including Asians and mixed races (10.2 percent), and white non-Hispanics (82.7 percent).
Milwaukee County is the main area of focus in this report, which in 2016 included 69.0 percent of all blacks and 70.3 of all black children in the state.
Researchers measured the economic status of children by the incomes of their families. Family units with black children accounted for 11.8 percent of all Wisconsin families in the 2016 ACS sample, but 39.5 percent of all families with children in Milwaukee County (see Figure 1).
Factoring in other children of color, 65.4 percent of all families with children in Milwaukee County are black, Hispanic, or other groups including those of Asian descent and American Indians.
Figure 2 shows racial and ethnic trends in overall poverty statewide according to the WPM for all of Wisconsin. The patterns are clear, and the lines do not cross anywhere from 2008 to 2016.
The black poverty rate is more than two-and-a-half times the overall Wisconsin poverty rate, and three to four times the white poverty rate. Hispanics and other races have poverty rates between blacks and whites, but these rates are still more than twice the rates of poverty among whites.
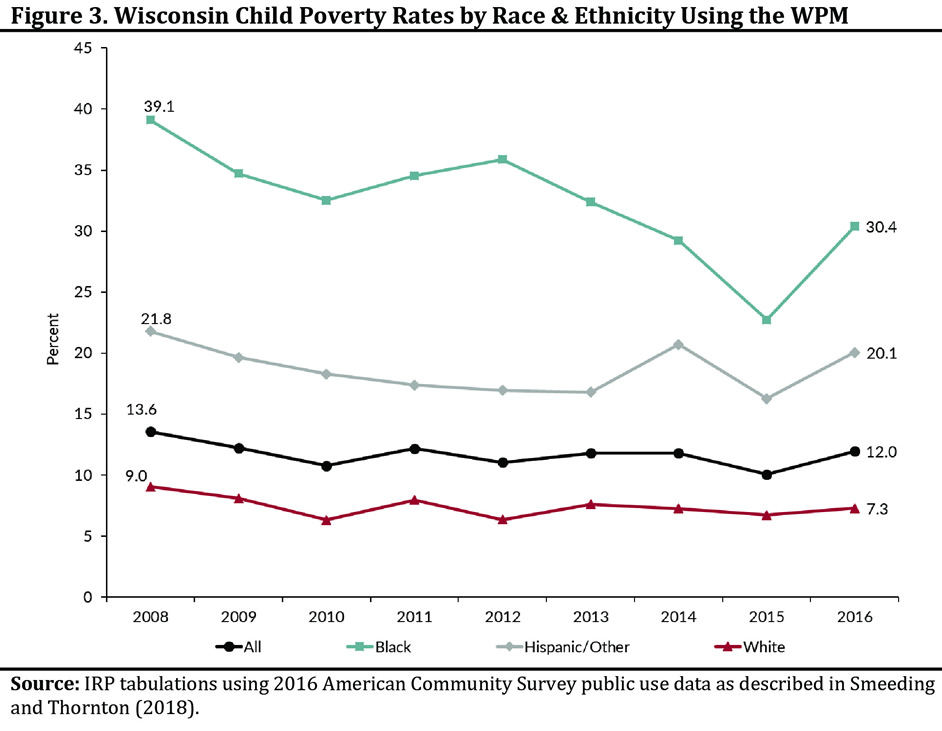
Statewide, child poverty largely follows the same trends (Figure 3). While child poverty rates are above overall poverty rates, once again the lines do not cross.
Although there appears to be some progress in reducing child poverty in Wisconsin—especially black child poverty, which has fallen from 39.1 percent in 2008 to 30.4 percent in 2016—the rates for children of color remain multiple times higher than those for white children.
The supplement puts a finer point on what was learned from this year’s full Wisconsin Poverty Report, released in June 2018, which found that the declines in poverty in 2014 and 2015 stalled in 2016. This statewide trend masked considerable variation across the state.
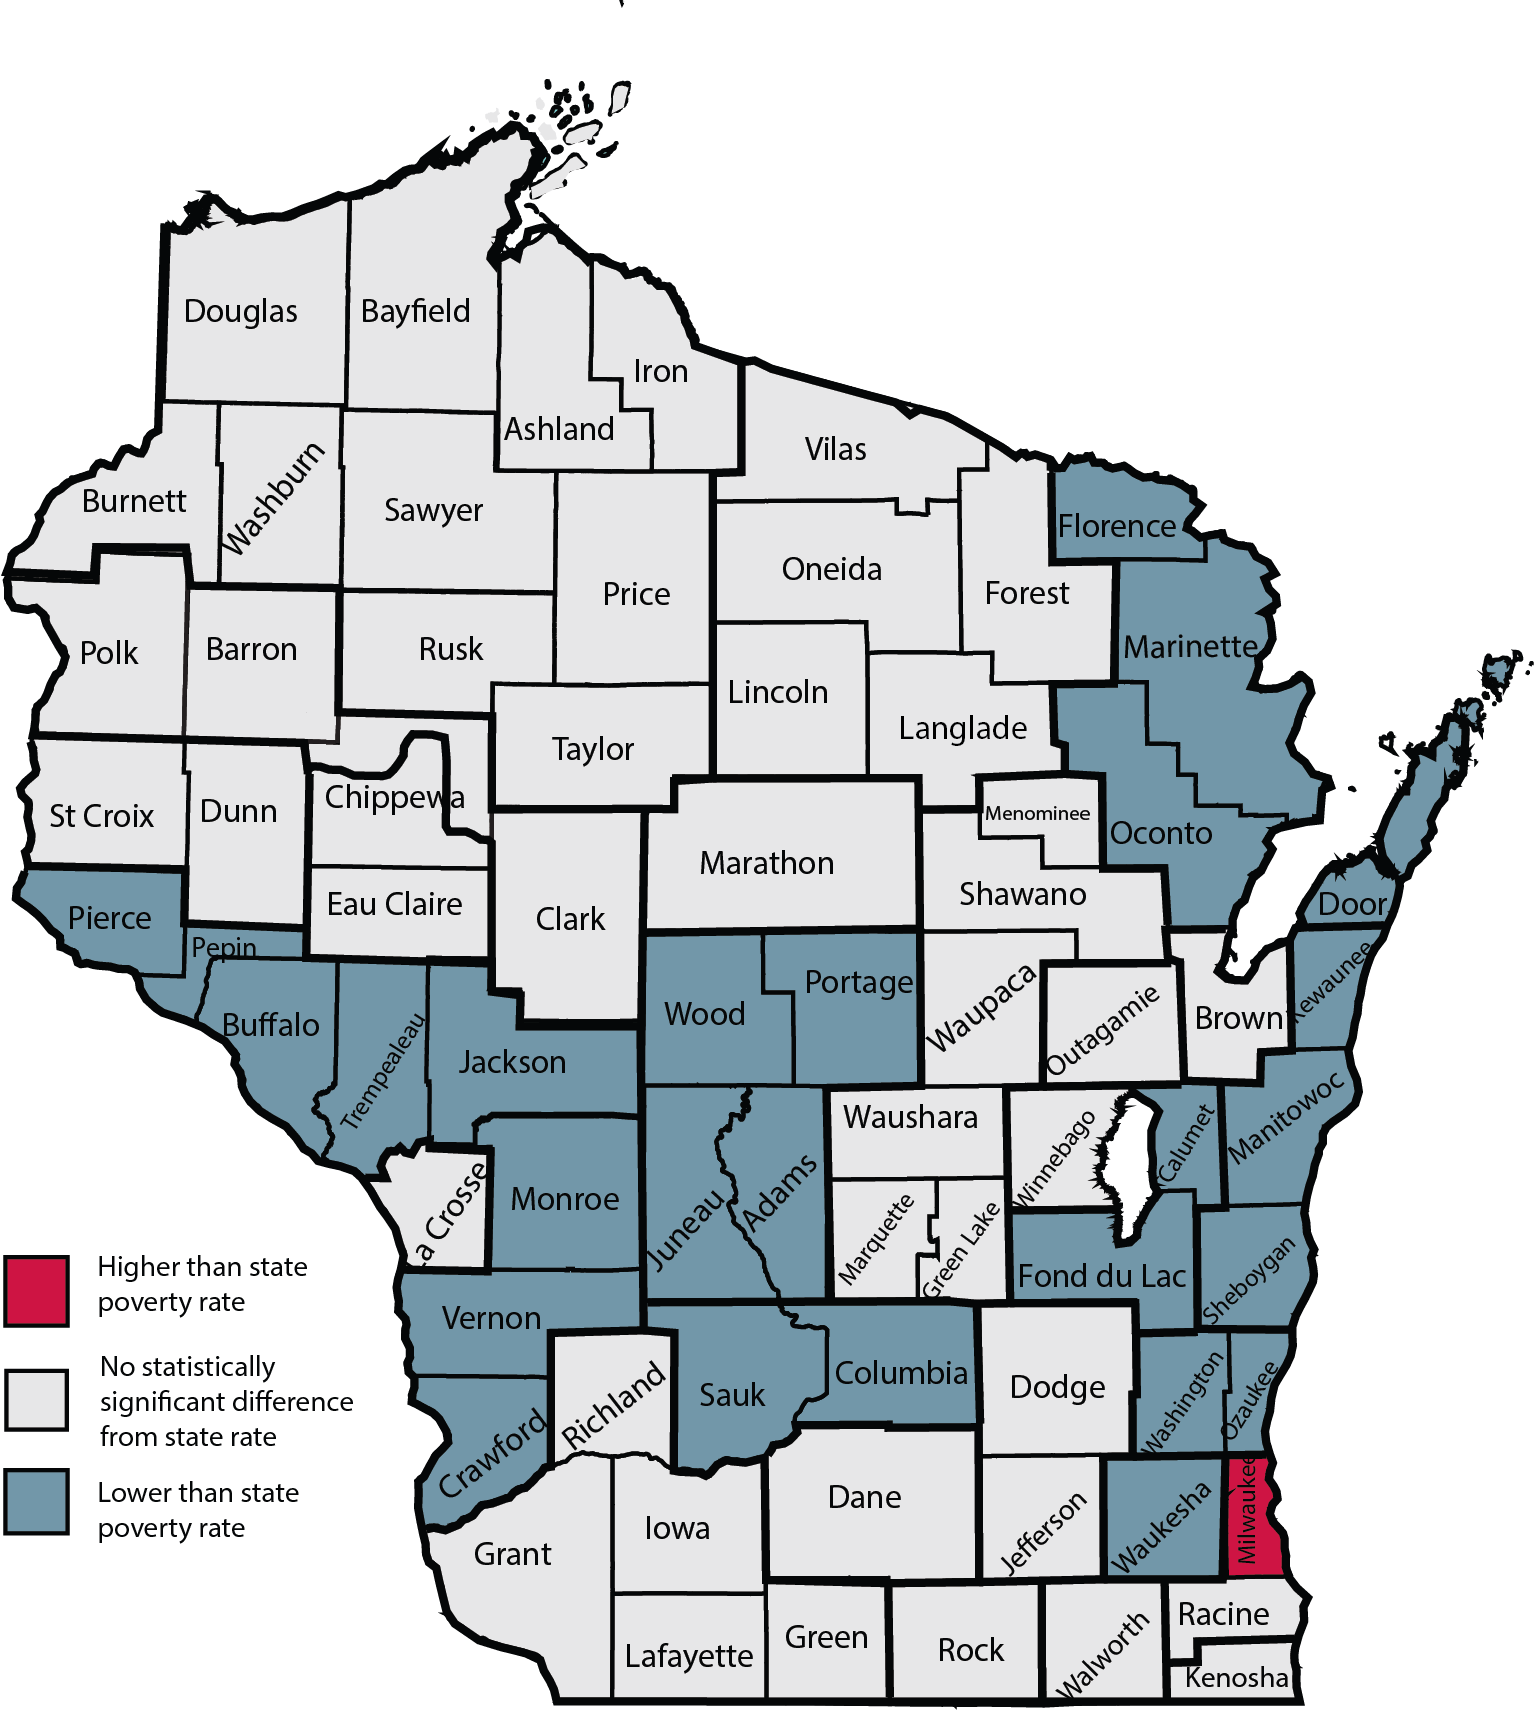
In 29 Wisconsin counties, poverty was below the state average in 2016, while 42 counties had poverty rates not significantly different from the state average. Only one county had a substantially statistically higher poverty rate—Milwaukee, at 17.5 percent.
While the overall poverty rate in Wisconsin rose from 9.7 to 10.8 percent from 2015 to 2016, the comparable change in Milwaukee County was from 16.3 to 17.5 percent.
The map below from the full report on overall poverty by area reveals the report’s bright side: 26 counties have WPM poverty rates below the 10.8 percent state average, which is the highest proportion since the report began in 2008.
Brad Paul, Executive Director of the Wisconsin Community Action Program Association (WISCAP), which supports the Wisconsin Poverty Report, commented, “This supplement to IRP’s annual study reveals large racial and ethnic disparities in poverty around the state, especially concentrated in Milwaukee County. It tells us just how great the need is for comprehensive public policy solutions and a broad commitment to fight poverty in our state.”
IRP Director Lawrence Berger notes, “In this supplement to the ongoing Wisconsin Poverty Project, we learn that families of color in Wisconsin, and especially in Milwaukee County, have much higher poverty levels than white Wisconsinites. The report highlights geographical areas of greatest need within Milwaukee County, providing a roadmap for antipoverty efforts that could reduce disparities for people of color.”
-
Interwoven
How Indigenous knowledge and science can work together to communicate about climate.
-
UW–Madison’s reach throughout Wisconsin adds up to $38.9 billion a year
The university supports more than 287,000 jobs and helps drive private-sector growth.
-
‘Being part of something bigger than you’ with Badger Volunteers
UW–Madison students head into the local community to find purpose and make a difference.
-
UW–Madison’s Tech Exploration Lab: Where the classroom meets the real world
The lab is built around a simple expectation: Students come to build, test and refine projects with real problems in mind.