Snowfall patterns may provide clues to Greenland Ice Sheet
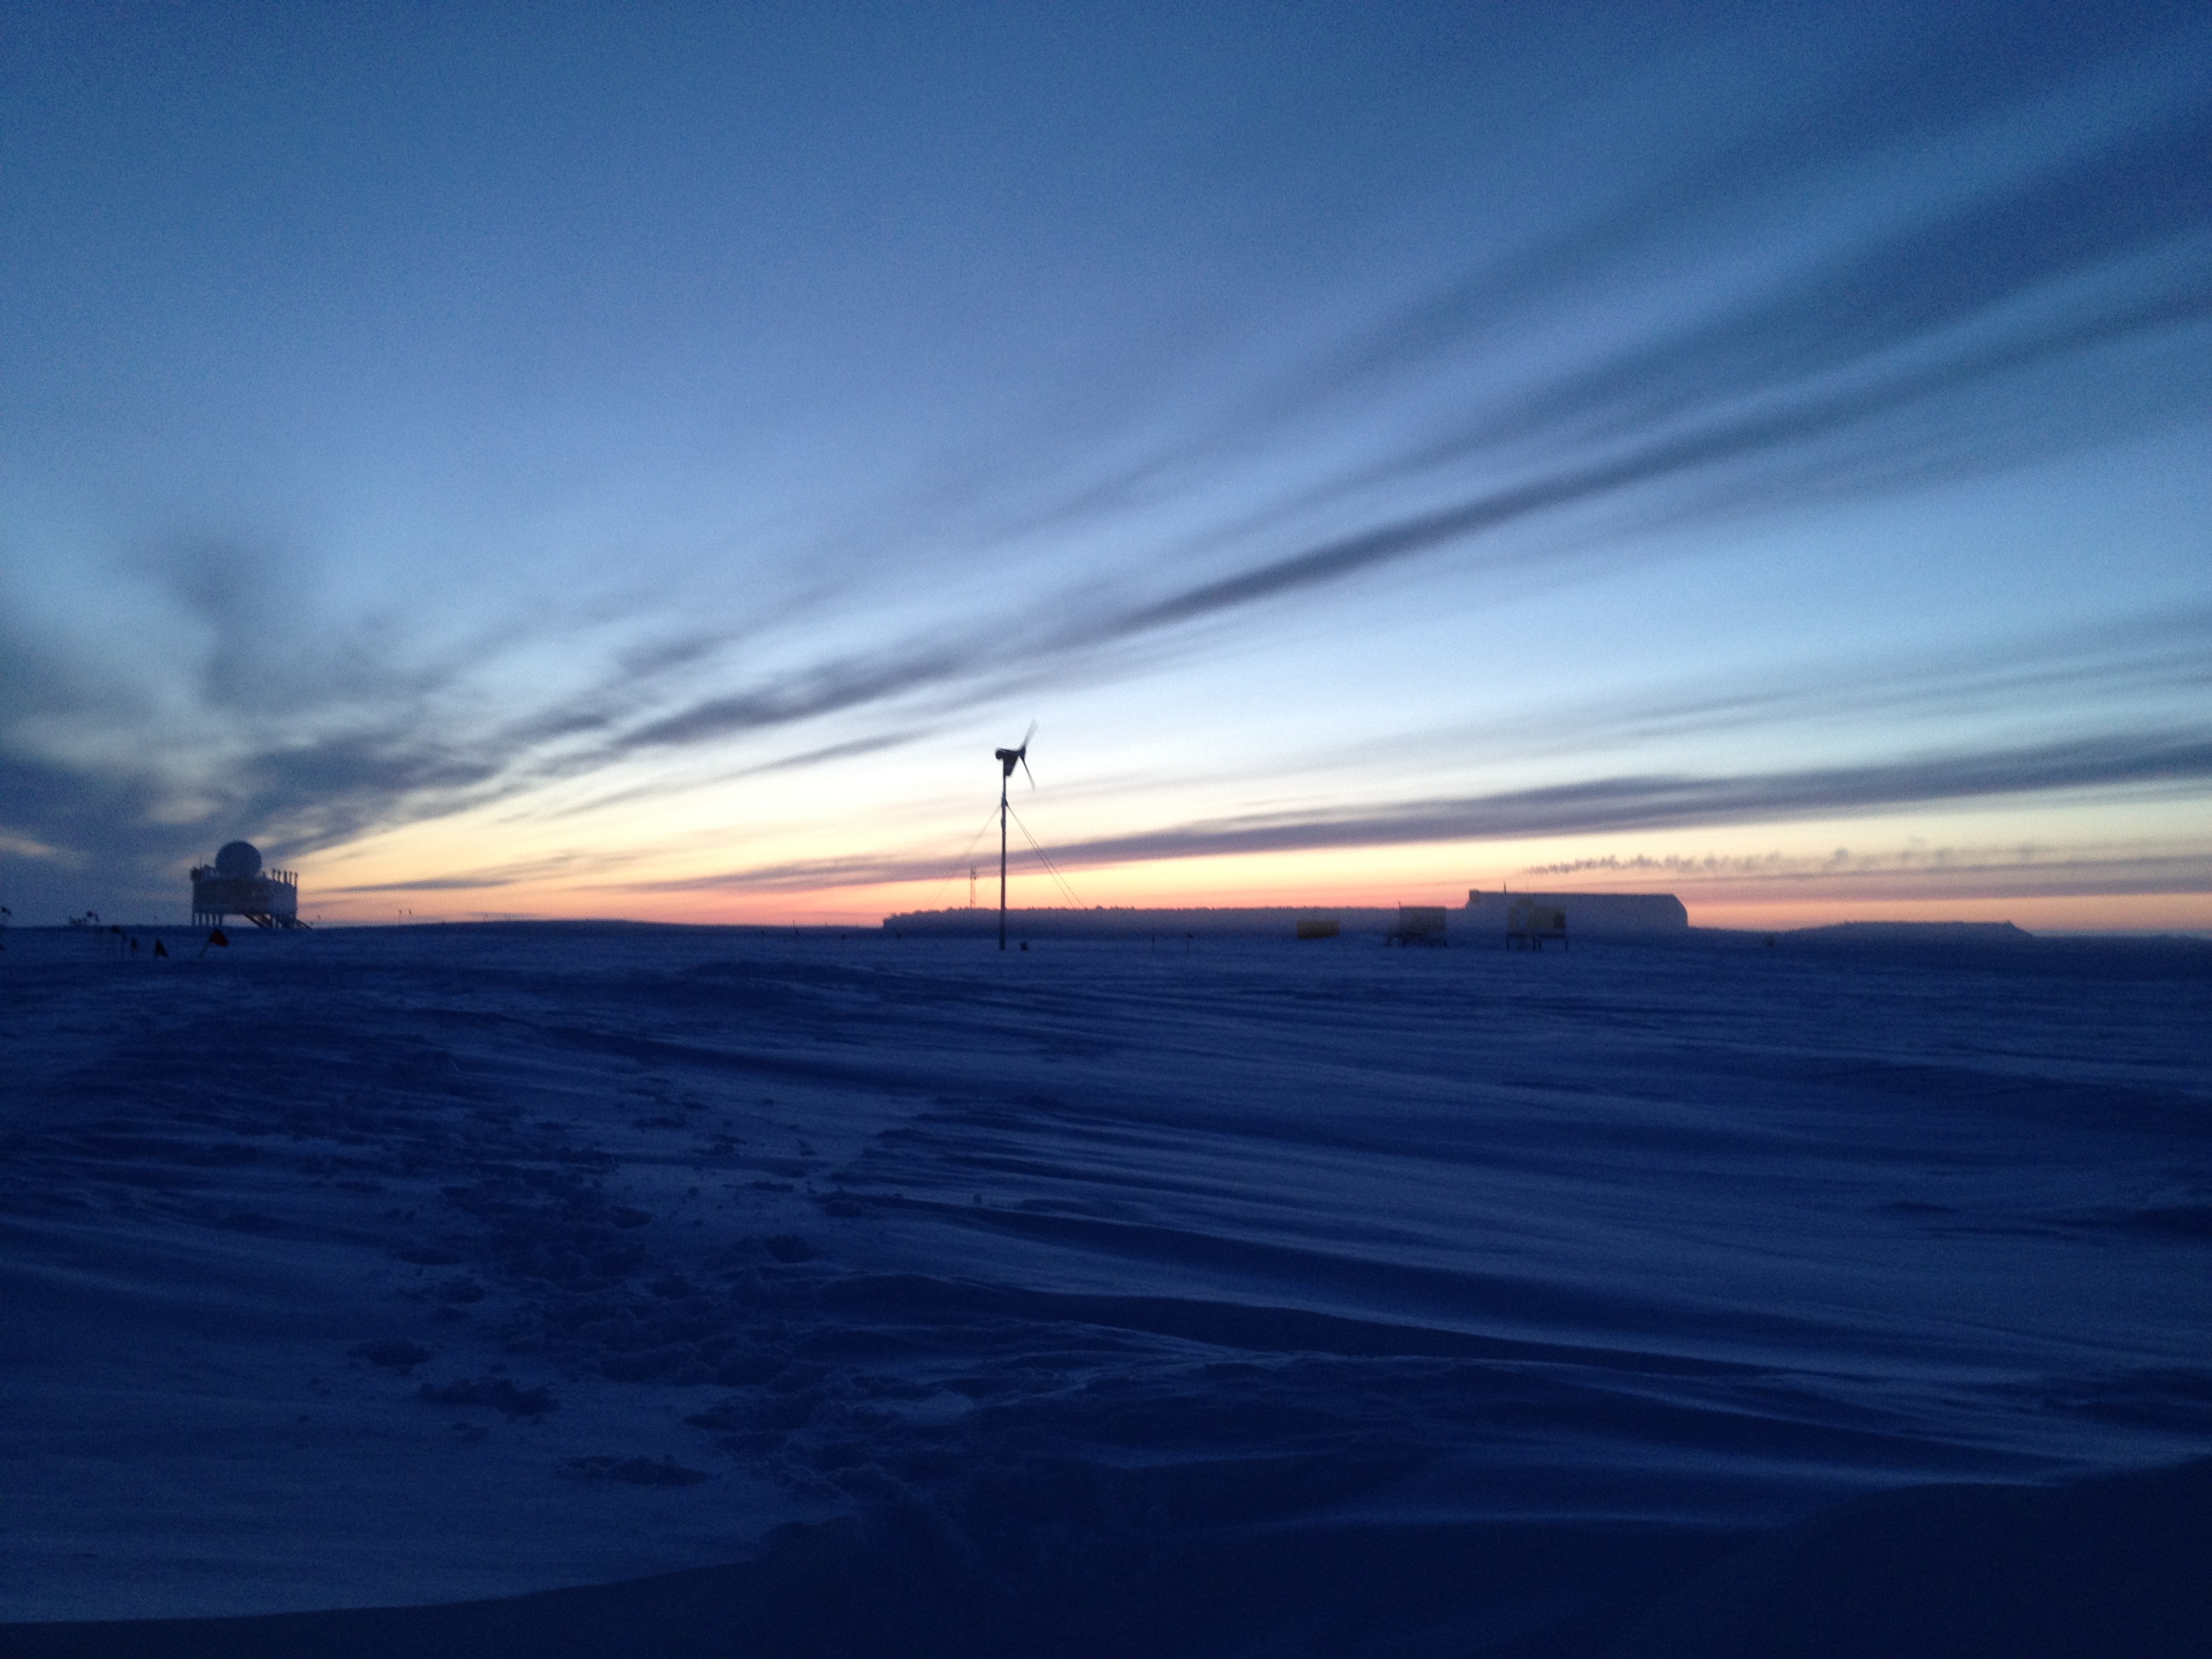
The new study involved examining the distinct paths clouds take before they produce snow at Summit Station, a longstanding research station located in the middle of Greenland. Photo by Claire Pettersen
The Greenland Ice Sheet is melting, discharging hundreds of billions of tons of water into the ocean each year. Sea levels are steadily rising.
To better understand and anticipate changes in sea level rise, scientists have sought to quantify how much snow falls on the ice sheet in any given year, and where, since snow is the primary source of the ice sheet’s mass. This has proven to be a challenging problem.
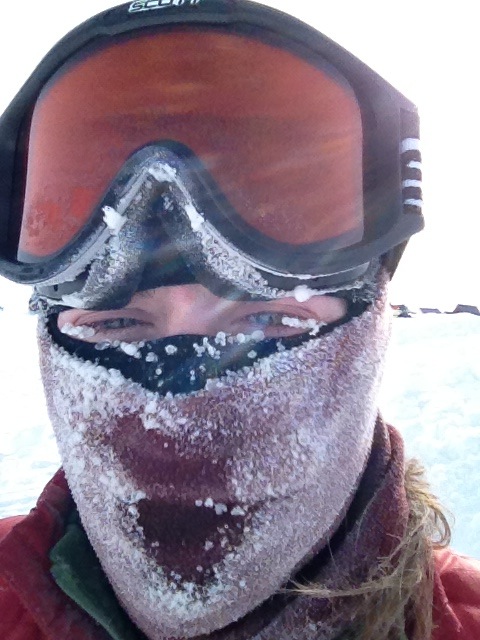
Claire Pettersen at Summit Camp. Photo by Claire Pettersen
However, a new study from a team of researchers led by University of Wisconsin–Madison Space Science and Engineering Center scientist, Claire Pettersen, describes a unique method involving cloud characteristics that could help answer some big questions about the Greenland Ice Sheet and its snowfall. The study is published today [April 9, 2018] in the journal Atmospheric Chemistry and Physics.
“There are a lot of theories about how the precipitation processes over the ice sheet will change in the future,” says Pettersen. “Will it gain more as a result of increased precipitation or will it gain less due to decreasing precipitation?”
Pettersen’s approach involved studying the types of clouds that result in snow on the ice sheet, and examining the distinct paths these clouds take before they produce snow at Summit Station, a longstanding research station located in the middle of Greenland.
Regions of higher elevation on the ice sheet do not receive an abundance of precipitation, and Summit Station tends to be drier still. However, the precipitation it does receive is critical, Pettersen says, “because it is the only available source for building up mass on the ice sheet.”
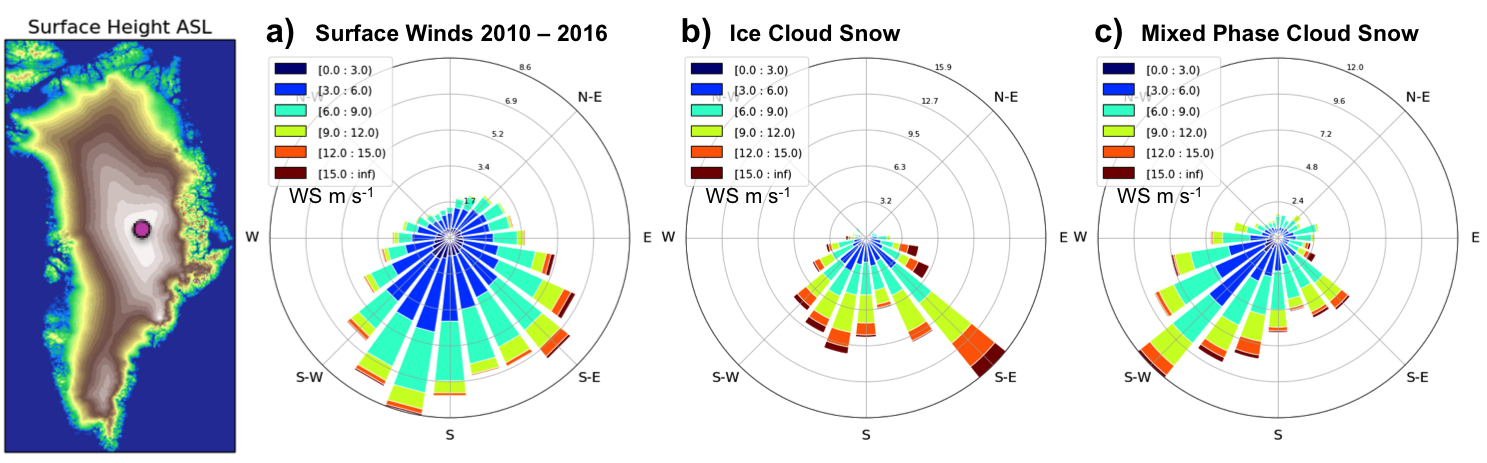
Left, the surface height of Greenland, created using measurements from the IceBridge campaign. Surface winds from the Summit NOAA meteorological data are shown in a-c: (a) shows all surface winds from 2010–2016 for all times; (b) shows surface winds for the ice cloud snow cases; and (c) shows surface winds for the mixed phase cloud snow cases. Credit: Claire Pettersen
Greenland is more than twice as large as Texas and if the entire ice sheet melted, scientists estimate global sea levels would rise roughly 24 feet.
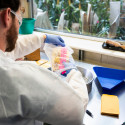
Pettersen and her team developed a tool that aggregated and processed five-year’s worth of data from the Integrated Characterization of Energy, Clouds, Atmospheric state, and Precipitation at Summit (or ICECAPS) experiment, relying on an array of ground-based, remote sensing instruments – from Doppler radar to an ice particle imaging camera – to collect atmospheric information.
Pettersen took advantage of a wealth of data from an instrument typically used to measure characteristics like temperature and humidity, called a microwave radiometer, and from it gathered information about cloud liquid water and ice within clouds above Greenland.
She discovered that precipitation at Summit came from two distinct cloud types. The first, mixed-phase clouds, hold water vapor, supercooled cloud liquid droplets, and ice particles. They are common across the Arctic.
The second type, ice clouds, contain only ice crystals and no cloud liquid water. These clouds tend to be deep, with cloud top heights reaching as high as 10 km above sea level, Pettersen explains.
Snow-producing mixed-phase clouds originate along the southwest coast of the Greenland Ice Sheet, where the upward slope to Summit is gentle and unimpeded. Pettersen found they produce 51 percent of the snow accumulation observed at Summit.
Ice clouds, on the other hand, are a feature more common to the southeast coast of Greenland, where they face a unique obstacle: To reach Summit Station from the North Atlantic, they must overcome a steep ridge.
“If you have a strong storm system, it can generate enough uplift to pull moisture from near the ocean’s surface up over the ridge, and traverse the high plateau of the central Greenland Ice Sheet,” Pettersen explains.
Though a rather intense process, it is an effective way to transfer moist ocean air into the center of Greenland, she adds. The team found these types of clouds account for 35 percent of the snow that builds up at Summit.

The Big House, one of the permanent structures at Summit Station, a research site on the Greenland ice sheet. Photo by Claire Pettersen
Together, these two processes – from two different directions that follow distinct northern-bound tracks – help provide key mechanisms to account for snowfall at this region of the Greenland Ice Sheet. The atmospheric dynamics responsible for the distinct snow types could be an important piece of the Arctic climate puzzle, says Pettersen.
Unlike prior studies, which relied on models or indirect data, her team was able to use observations gathered directly from the study region, yet they are consistent with earlier findings. Pettersen is hopeful that, with more data analysis over longer periods of time, researchers will find more answers yet to account for the melting ice sheet and the subsequent sea level rise that has already had an impact on regions across the planet.
“Understanding the processes that create precipitation at Summit Station will help us to further understand the mass balance of the Greenland Ice Sheet, which is directly tied to changes in sea level rise,” says Pettersen.
Study collaborators include researchers from Vanderbilt University, the Cooperative Institute for Research in Environmental Science at University of Colorado, the National Oceanic and Atmospheric Administration’s Earth System Research Laboratory, and Washington State University. This study was supported by multiple grants from the National Science Foundation.
-
Interwoven
How Indigenous knowledge and science can work together to communicate about climate.
-
UW–Madison’s reach throughout Wisconsin adds up to $38.9 billion a year
The university supports more than 287,000 jobs and helps drive private-sector growth.
-
‘Being part of something bigger than you’ with Badger Volunteers
UW–Madison students head into the local community to find purpose and make a difference.
-
UW–Madison’s Tech Exploration Lab: Where the classroom meets the real world
The lab is built around a simple expectation: Students come to build, test and refine projects with real problems in mind.