Online map allows visitors, naturalists to share Arboretum experience
If the UW Arboretum were just a pretty place to take a walk, its new Interactive Map wouldn’t need much more than crisscrossing trails, grey blobs for parking lots and symbols marking the restrooms.
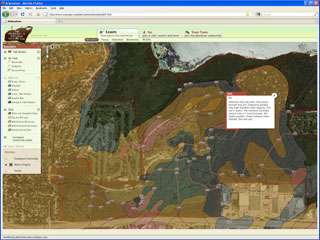
The UW Arboretum’s new interactive map allows you to study many aspects of the arboretum, including its various soil types as seen above.
“One of the things we struggle with is getting across the notion that it’s not just a beautiful place,” says Mark Wegener, database manager at the Arboretum and architect of the map, which is now available to users. “People think it’s just gorgeous and they love it here, and that’s great. But there’s so much more to the Arboretum.”
Much of it will be available on the “I-MAP,” which draws from stacks of digitized data on the Arboretum to paint a customizable picture of the unique outdoor laboratory.
“The map can give you the basics, but also detail on the really rich history and the research going on here and the volunteer program and just about anything you’re interested in knowing about the Arboretum on any level,” Wegener says.
For years Wegener and members of the University of Wisconsin–Madison Cartography Lab have accumulated descriptions of the Arboretum grounds from cultural, botanical, zoological and geological perspectives, adding information in layers users can add and subtract from their computer screens with the click of a mouse.
“One of our expectations for the map was that our visitors and students and researchers would be able to make it useful for their unique purposes,” says Kevin McSweeney, Arboretum director, “and — very importantly — that they could add their own notes and photos and descriptions to the map to share with other people.”
It’s a ready-made community, but one that is often walking paths in groups of one or three, enjoying some solitude. Now those people can tag favorite trails or the spot they heard a rare bird’s call or even photos of turkeys strutting around.
“We’re pretty good at connecting with people who have been around Madison for a while and really treasure the place,” Wegener says. “But I think getting a lot of this information on the Internet lets them share their experiences with casual visitors who don’t have a mental picture of the Grady Tract, for example.”
Wegener’s favorite features provide ready answers to common questions — like the way users can trace a route around the trails and, using the measuring tool, get a quick and accurate distance for their walk or run.
“That’s something we get asked about a lot. I’ll get messages that are long strings of characters representing our trail numbers — ‘I run from G-3 to F-6 to A-9 to C-3. How far is that?'” Wegener says.
It’s almost a mile and a half, according to I-MAP, which also fills in blanks for people who aren’t passing through quite so fast.
“Scientists and students are often mapping out research plots, and they want to know which way the water is moving and what they layout is like,” says Wegener, who built expansive soil type designations, hydrogeology measurements and storm water flow characteristics into map’s many features. “Lots of people just want a good aerial photo, so the map has them going back 30, 60 years.”
I-MAP replaces a color-coded and trail-clogged PDF file on the Arboretum’s website, organizing the new data into tabs marked “Learn” (with information on the Arboretum’s history, biodiversity and watershed), “Go” (for mapping out hikes, finding volunteer opportunities specific plant families) and “Your Turn” (where pictures and notes can be added by visitors and staff).
Plans are to keep the map fresh with contributions from the people who know the Arboretum best. Naturalists’ Notes, a popular feature of the Arboretum’s website written by its naturalists about the seasonal changes in plants or animal activity they notice while out on the trails, can now be pegged to corresponding locations on I-MAP.
“There’s a whole array of interesting remotely sensed data — identification of individual tree species and health, thermal deer counts, linking audio of bird songs to the place they were recorded,” McSweeney says. “We’re at the tip of the iceberg with this.”
The map’s most powerful feature may be that it’s never finished.
“Now that it’s built, we can expand without having to start over,” Wegener said. “Staff and visitors will be able to say, ‘You know what I’d really like to see?’ And we’ll be able to do it.”
Tags: arboretum, biosciences
-
Interwoven
How Indigenous knowledge and science can work together to communicate about climate.
-
UW–Madison’s reach throughout Wisconsin adds up to $38.9 billion a year
The university supports more than 287,000 jobs and helps drive private-sector growth.
-
‘Being part of something bigger than you’ with Badger Volunteers
UW–Madison students head into the local community to find purpose and make a difference.
-
UW–Madison’s Tech Exploration Lab: Where the classroom meets the real world
The lab is built around a simple expectation: Students come to build, test and refine projects with real problems in mind.