Poll takes Wisconsin’s temperature on policy in leadup to 2022 elections
The La Follette Policy Poll, released by UW–Madison’s La Follette School of Public Affairs, finds residents divided along party lines on issues like climate change and government regulation but generally in agreement on others, such as concerns about healthcare and retirement savings.
Susan Webb Yackee
According to Professor Susan Webb Yackee, the school’s director, the poll “is not a political survey, but instead an investigation of public perceptions about policy issues in the state and national arena.”
With Wisconsin poised to be a battleground state in the 2022 elections, residents’ opinions on vital policy issues could have national implications.
The polling questions covered a range of topics, including:
- The most pressing issues facing the U.S. and Wisconsin
- Confidence in government
- Personal finances and the economy
- Water quality, climate and the environment
- Government regulation
- Racial equity
Nearly 1,600 residents answered the eight-page survey, distributed by mail to 5,000 randomly selected households, for a 33% response rate. The margin of error for the full sample is +/- 2.5% (at 95% confidence). The complete set of poll questions and results is available for download. Details on the poll’s methodology are available here. The La Follette Policy Poll website includes links to interactive analyses of the poll data created in Tableau Public, a free online data visualization website.
”By working with the UW Survey Center, we created an authoritative poll, with responses from every corner of the state, including 71 of Wisconsin’s 72 counties. We made sure that we gathered opinions from across the entire state, including in rural Wisconsin,” says Yackee.
The poll was in the field from July 14 to September 24, 2021. Because it is representative of the state as a whole, and because it focuses on persistent Wisconsin attitudes rather than attempting to capture a political snapshot, the results provide a revealing portrait of public opinion in a state that could affect the national balance of power this November.
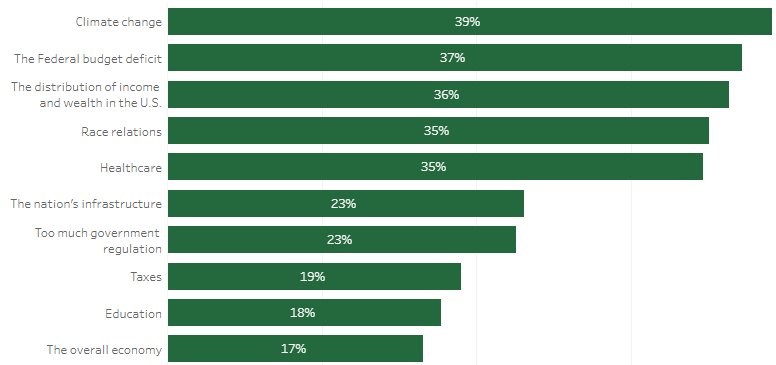
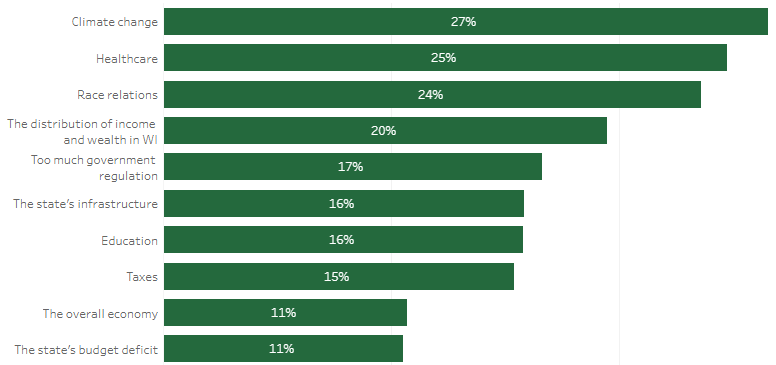
What do Wisconsinites worry about most?
Respondents answered questions about a variety of policy issues, ranking each as: not a problem, a small problem, somewhat of a problem, quite a problem, or an extremely big problem. This allowed the poll to zero in on exactly what’s keeping Wisconsin residents up at night.
On every issue, residents are more concerned about what is happening in the nation than the situation in Wisconsin. For example, 39% of respondents thought climate change was an extremely big problem nationally, but only 27% felt the same about climate change in the state. Likewise, 35% of respondents ranked race relations as an extremely big problem nationally, while only 24% thought that was true in Wisconsin.
 An interactive analysis of the problem assessment data is available on Tableau here.
Yackee explains, “Wisconsin elections are becoming increasingly nationalized—they affect outcomes in the country at large. The La Follette Policy Poll points to some reasons why that is true. Wisconsinites—and I mean all Wisconsinites, Democrats, Republicans and Independents—view public policy issues as more problematic in the U.S. overall than in our state. This suggests that a national lens on public policy issues like healthcare, climate change, the budget deficit and government regulation might get folks more engaged and make them more likely to vote.”
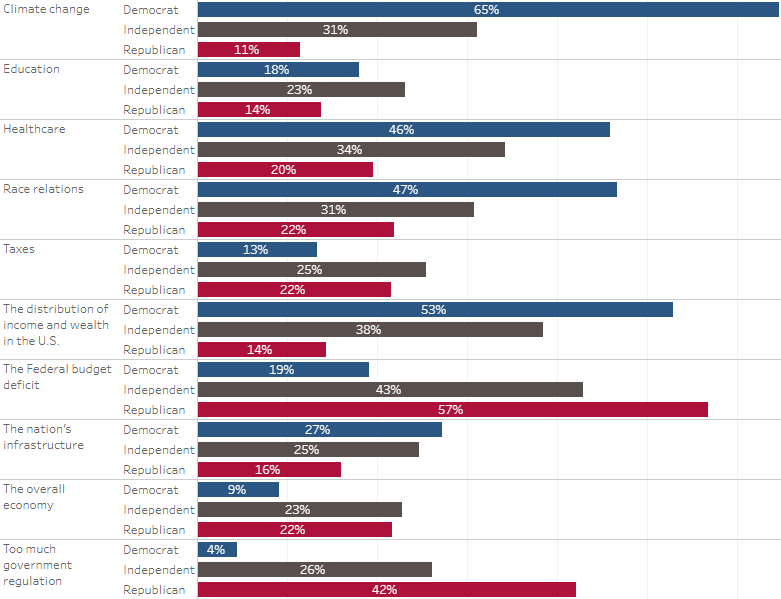
Breaking down the data by political identification, age and gender provides some interesting comparisons. For example, Democrats are more concerned about climate change and income and wealth distribution, while Republicans are more concerned about the federal deficit and government regulation.
 Younger respondents consistently rank climate change, healthcare and income and wealth distribution as bigger problems than older respondents.
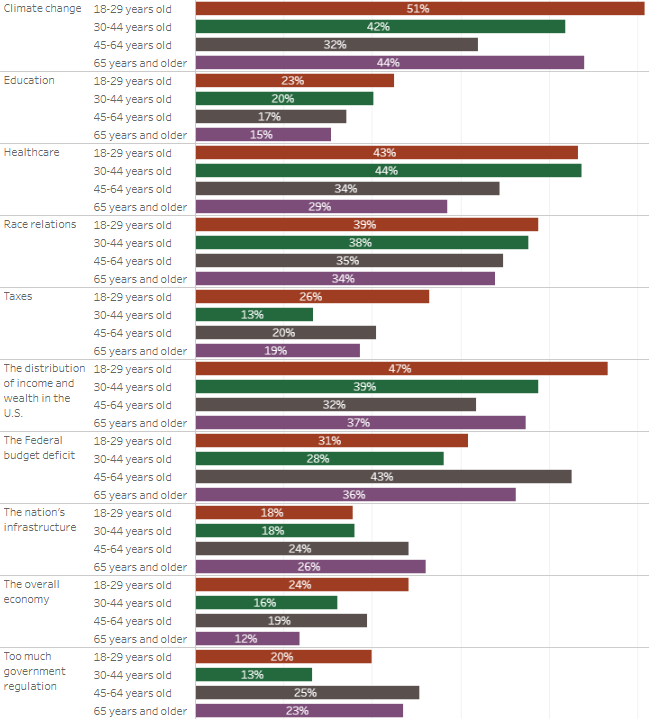 The widest differences in opinions on climate change, healthcare, race issues and income and wealth distribution are apparent when the poll responses are broken down by gender. Respondents identifying as female are more likely to call climate change, healthcare, race relations and income and wealth distribution extremely big national problems than males
 How much confidence do Wisconsinites have in federal, state and local government?
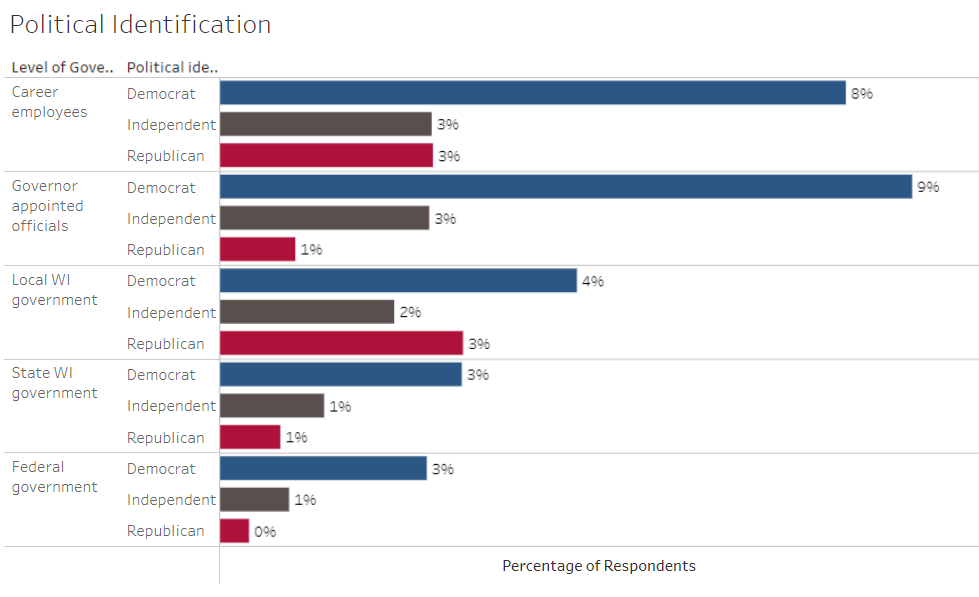
Respondents were asked to rate their level of confidence in public officials at the local, state and federal levels to “act in the best interest of the public.” Options ranged from “no confidence” to “a great deal of confidence.” The results show clearly that Wisconsinites had the most confidence in officials at the local level and the least at the federal level. Democrats were also generally more confident in public officials than Republicans at all levels.
“The poll results regarding confidence in government echoed the responses on policy issues, in that Wisconsinites expressed greater concerns at the national level,” says Yackee.
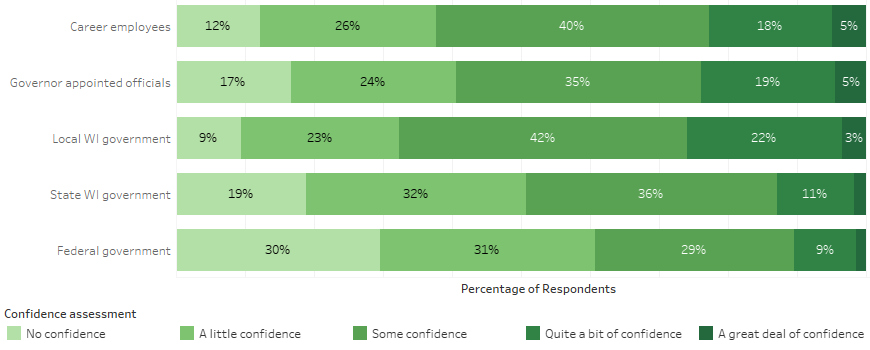 Associate Professor Manuel Teodoro notes that “Partisanship strongly correlates with confidence in government at all levels, with Democrats generally more confident than Republicans at all levels. It’s also clear that confidence in state and federal government varies considerably by race, with white respondents expressing significantly greater confidence than racial/ethnic minority respondents.”
 An interactive analysis of the confidence in government data is available in Tableau here.
What do Wisconsinites think about climate change?
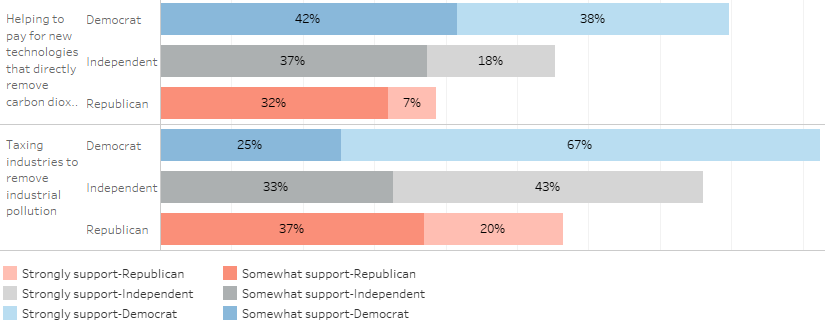
The poll results show that climate change ranks as a top issue for Wisconsin residents, with 59% of all respondents ranking it as quite a problem or an extremely big problem. While more Democrats rank climate change highly than Republicans do, there’s widespread support across the political spectrum for solutions to climate change. These include helping to pay for new technologies that directly remove carbon dioxide from the atmosphere and taxing industries to remove industrial pollution.
 La Follette School Professor Gregory Nemet says, “These poll results are insightful because they indicate that there is more bipartisan agreement on the need to do something on climate than political rhetoric would suggest.”
Assistant Professor Morgan Edwards, also of the La Follette School, explains, “More Wisconsinites support than oppose almost every climate change policy we polled (with the exception of building new nuclear power plants), from including the cost of carbon when approving new energy infrastructure to helping pay for new technologies to remove carbon dioxide from the atmosphere. Policies to invest in renewable energy and reduce pollution are particularly popular. Seventy percent of Wisconsinites support doubling the amount of electricity coming from renewables, and 76% support taxing industries to remove industrial pollution. These policies create benefits beyond climate change, including creating renewable-energy jobs and reducing emissions of air pollutants that harm human health.”
An interactive analysis of the climate change poll results is available on Tableau here.
How concerned are Wisconsinites about racial issues?
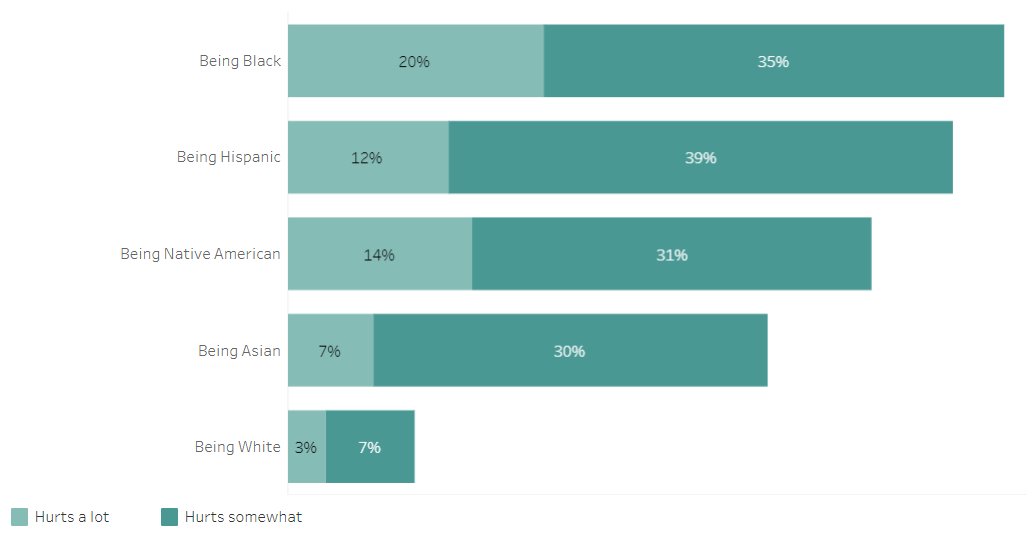
Questions about race and equity focused on how much race affects a person’s ability to get ahead in Wisconsin, as well as gauging support for efforts designed to improve racial equity in the state. Respondents generally feel that race does indeed affect a person’s ability to get ahead. Fifty-five percent of respondents think being black hurts a person’s chances a lot (20%) or somewhat (35%). The numbers for other groups are similar. More educated respondents are more inclined to think race plays a role in a person’s ability to get ahead. Respondents tend to view race as more of an issue in the nation at large than in Wisconsin.
Some equity-focused measures generate strong opposition, including paying cash reparations (57% strongly oppose, 12% somewhat oppose) and taking race into account for college admissions (46% strongly oppose, and 15% somewhat oppose). Funding training on diversity generates lower resistance (24% strongly oppose), but the number of people who strongly oppose it is similar to the number of people who strongly support it, suggesting polarization around the topic.
 The race issues poll results are available on Tableau here.
Are Wisconsinites worried about their family finances?
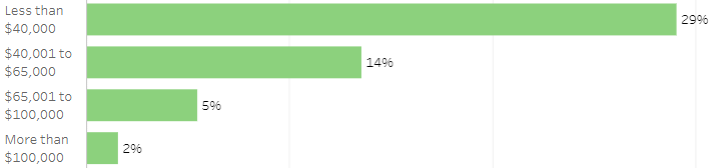
Questions about family finances revealed Wisconsinites’ readiness to deal with an unexpected expense. Studies show that the ability to handle a $400 unexpected expense is a key indicator of family financial resilience. Not being able to handle a financial emergency is a source of stress and diminishes family financial well-being. Poll results show that only 13% of Wisconsin respondents say they cannot handle a $400 unexpected expense. However, the inability to deal with an unexpected expense is much higher (29%) for those with income under $40,000.
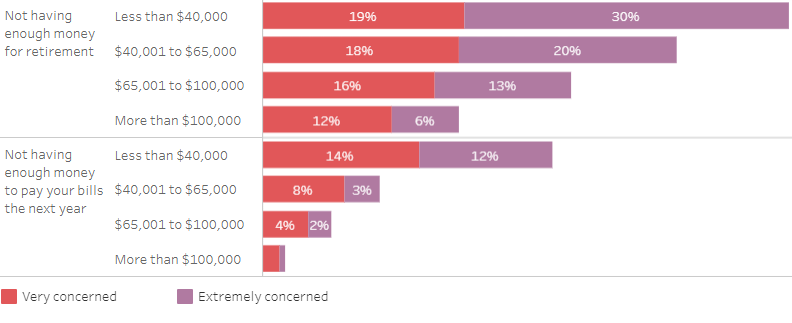
Worrying about paying bills is another source of stress for families. Only 12% of Wisconsin respondents say they are very or extremely concerned about being able to pay their bills this year. The percentage of people who worry about paying bills is more than two times higher (26%) for those with income under $40,000.
 The poll also captured residents’ concerns about retirement finances. Thirty-three percent of Wisconsin respondents say they are very or extremely concerned about not having enough money for retirement. Forty-nine percent of people with income below $40,000 are very or extremely concerned about running out of retirement funds.
 According to La Follette School Professor J. Michael Collins, “Some workers have the ability to save through their employer, but many smaller businesses cannot afford to offer retirement plans. Wider access to retirement savings would improve the financial well-being of Wisconsin’s workers. In general, these patterns are predictable. As highlighted by the report issued by the Governor’s Retirement Security Task Force, Wisconsin doesn’t match states like Illinois in supporting retirement benefits.” Collins, a member of the task force, helped write the report.
An interactive analysis of the family finance poll results is available on Tableau here.
What do residents think about water quality in Wisconsin?
About two-thirds of Wisconsinites receive tap water service at home from a water utility, with one-third getting home tap water from a private well. Respondents rated the state’s air quality slightly higher than its overall water quality.
Professor Teodoro points out that “On average, Wisconsinites favor addressing water quality challenges according to a polluter pays principle. When asked about measures to address water quality:
- Seventy-five percent strongly supported or somewhat supported rules requiring farms to maintain a 15-foot buffer between cropland and rivers or lakes.
- Fifty-five percent strongly supported or somewhat supported taxing fertilizers to reduce runoff from farms.
- Forty-two percent strongly supported or somewhat supported limits on construction of new high-capacity wells.
- Thirty-five percent strongly supported or somewhat supported raising water utility rates to pay for removal of industrial chemicals.
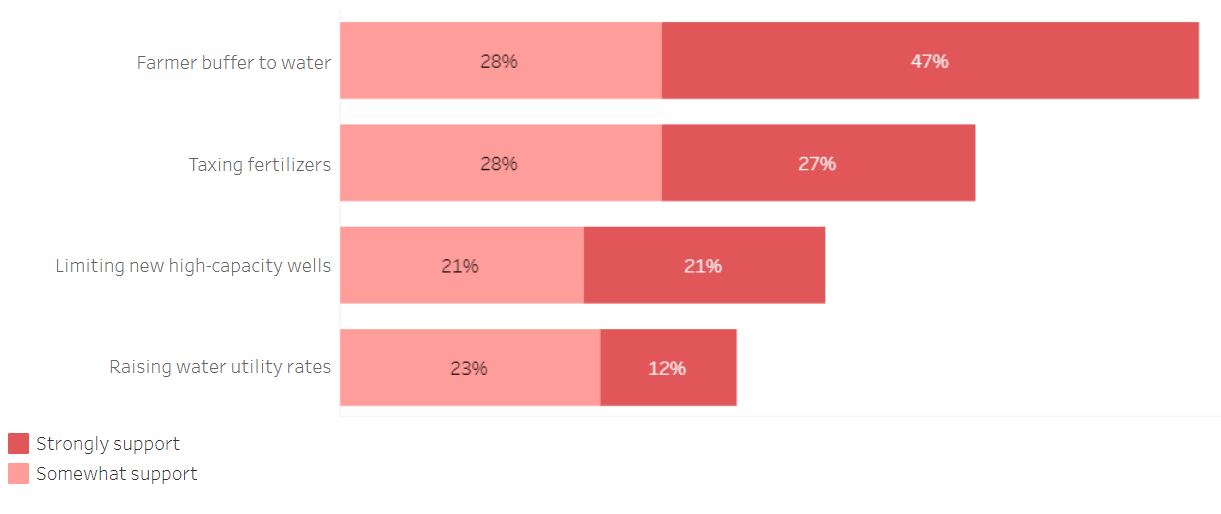 An interactive analysis of the water quality poll results is available on Tableau here.
How much do Wisconsinites participate in political activities?
Respondents participated in a variety of political activities over the past year, starting with 69% voting in-person sometime during the year and 49% voting absentee, with Republicans more likely to vote in person (80%) than Democrats (63%) or Independents (62%). About a third of respondents (36%) reached out to contact a public official, signed a political petition (34%) or posted on social media about a political issue (33%). Respondents who identify themselves as Independents were less likely to participate in most political activities compared to Republicans and Democrats. For example, only 16% of Independents put up a political sign in the last year, compared to 32% of Democrats and 32% of Republicans. The rate of political participation varies little by gender.
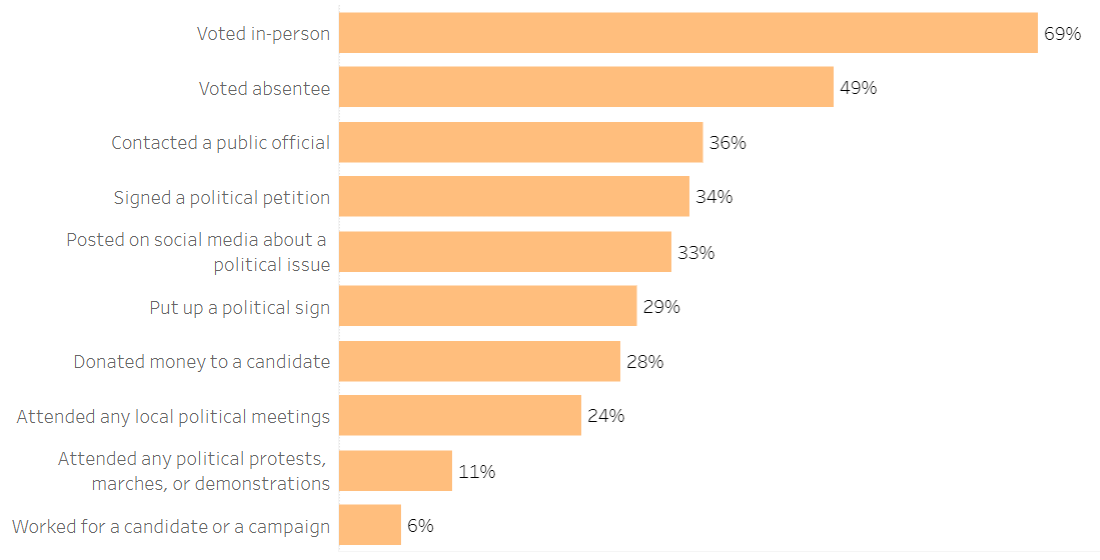 An interactive analysis of the political participation poll results is available on Tableau here.
Interacting with the poll data in Tableau Public
The graphs included in this press release were created in Tableau Public. The poll’s webpage includes a link to a Tableau site where people can interact with the data, creating analyses of the poll results.
-
Interwoven
How Indigenous knowledge and science can work together to communicate about climate.
-
UW–Madison’s reach throughout Wisconsin adds up to $38.9 billion a year
The university supports more than 287,000 jobs and helps drive private-sector growth.
-
‘Being part of something bigger than you’ with Badger Volunteers
UW–Madison students head into the local community to find purpose and make a difference.
-
UW–Madison’s Tech Exploration Lab: Where the classroom meets the real world
The lab is built around a simple expectation: Students come to build, test and refine projects with real problems in mind.